
'65 Twin Reverb Amp Push-Pull
Oct 22, 2013
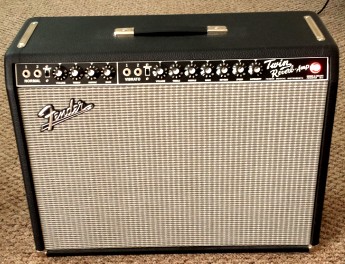 This article presents measurements and discussion of the push-pull power output stage for the vintage reissue Fender '65 Twin Reverb guitar amplifier model AB 763.
Items discussed include:
- a high-power dummy load for testing
- output tube bias conditions and achievable range
- using 2 power output tubes instead of the default 4
- plate dissipation limits and improper output loads
- measurement of output voltage, plate voltage/current and control-grid voltages
- load-line design and analysis for maximum power
- a push-pull calculator for power output and plate dissipation for any number of power tubes
The intent of this article is to provide real measured results and use well-known analysis results from push-pull tube theory to provide some moderate level of understanding
of the expected maximum power output achieveable. Other aspects of amplifier perfornace such as distortion analysis are not discussed here but are covered in some of the references included.
High Power Dummy Load
A high-power switchable resistive dummy load shown below can be used for various meaurements on guitar amplifiers requiring a
nominal 8 or 4 ohm impedance. The power is dissipated evenly among the 4 or 8 resistors and is intended for amplifiers
with peak power outputs of ~ 100 Wrms. This conveniently avoids the high audio volumes from speakers. Also, since real speaker loads have a frequency-varying impedance,
it is useful as a reference point to have measurements on a purely resistive secondary load to compare with model calculations which usually assume a nominal resistive load for simplicity.
Specifically I have designed the load for my '65 Twin Reverb Reissue (TRR) amplifier.
This dummy load can also be used as a properly matched power shunt in combination with the standard 4 ohm speaker load.
Since my TRR is quite clean (distortion-wise) even at higher powers with the stock Fender GT6L6B (Sovtek 5881) tubes, I typically use various
distortion pedals to obtain my favorite overdrive sound. However the dummy load when used in a properly matched voltage divider network as shown below can be used
in combination with the unmodified amplifier and speakers at high powers to achieve overdriven tube distortion but at much lower speaker volume levels.
The dummy load consists of eight 10 ohm power resistors rated at 25 W each in a switchable series/parallel combination as shown below. The SPST switch should be rated to at least 5A.
This load produces an impedance of either 10 ohm (with switch as shown) using four resistors, or 5 ohm (with switch closed) using all eight resistors. For testing purposes these values are reasonable close to common
nominal speaker loads of 8 or 4 ohms. [Additionally, two 50 ohm power resistors added in parallel on opposite sides of the switch would produce loads of 8.3 and 4.2 ohm] :

With this arrangement, a number of useful additional "taps" (not shown) become available for various interesting uses. Additional toggle switches or a rotary switch can easily be configured
to facilitate load impedance selection over a broad range.


Application to the '65 Twin Reverb Reissue Amp
Using the Groove Tube Bias Kit and a good quality DVM, the plate voltage for the power tubes was measured to be ~ 455VDC and the zero-signal bias current (cathode or plate current)
was measured for each of the 4 power tubes with a range of 32 to 35 mA. These values are close to the median bias values suggested in
the GT manual for the stock Fender GT6L6B tubes. Using the bias adjustment potentiometer, the actual achievable range of control grid bias voltage for the '65 TRR amp
was found to be -43 to -61 VDC. Inspection of the schematic diagram for this amplifier confirms that this is the expected grid voltage adjustment range. For the Fender GT6L6B tubes this
grid voltage range can swing the idle cathode bias current over a range of 41 to 4 mA:
 Ib(mA)     Vg (volts)
 ------     ----------
   4          -61    (minimum "coldest" bias)
  15          -53    (default shipping value)
  33          -46    (nominal recommended value)
  41          -43    (maximum "hottest" bias)
For these tubes the "hottest" achievable bias current is 41mA which is well within the "safe" range of idle plate dissipation for this tube. Waveform tests below at a moderate power level only show cross-over distortion
below 10 mA bias with no indication of any cross-over distortion at 15 mA, the default bias I measured for my new Twin. Several owners have reported that Fender ships tube amps with the bias set
at a fairly low ("cold") level. The output waveform is slighly more rounded at 33 mA bias with
no noticeable difference in shape (or preceived sound) between 33 mA and the maximum hottest bias of 41 mA.
I perform the power tube bias test once a year. My '65 TRR was purchased new some 12 years ago. I have yet to replace any
of the power tubes (but the 12AT7 driver tube became noisy after 1 year and needed replacement). The amp sounds comparable to when purchased. However I don't
play frequently.

The setup used to test the amplifier with the dummy load using a USB function generator WGM-201 and dual channel oscilloscope DSO-101 from Syscomp Electronic Design is shown below.
Suitable precautions were taken during all measurements to ensure the voltage input range of the DSO-101 was not exceeded.
For these tests, the signal was applied to the reverb channel with bass, mid and treble settings at minimum and reverb/trem off. Driving a tube amplifier with a dummy load at very high levels can
reveal audible mechanical vibrations at some frequencies (a buzzing sound).
The twin speakers were disconnected as shown. Note that the "Int Speaker" jack MUST be used and NOT the Ext Speaker jack when a single speaker load connection is used. If no
load is connected to the "Int Speaker" jack, the output transformer is shorted:


The scope trace below, with probes across the 5 ohm resistive dummy load with an 800mVpeak input signal at 250Hz corresponds to a fairly high output power of ~ 53 Wrms.
There is negligible crossover distortion as expected for the bias point and the signal is fairly clean, as expected for the '65 TRR with not much evidence of tube saturation/distortion:

Make Your '65 Twin Growl
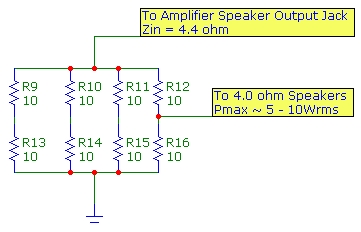
If the twin speakers are connected across one of the lower 10 ohm resistors to ground as shown,
without any other modifications to the '65 Twin Reverb circuit or the speakers, it is possible to limit the power delivered to the parallel
4 ohm TRR speakers while simultaneously driving the amplifier at very high levels with a proper load impedance. This pushes the output power tubes harder with the onset of more tube distortion.
Note that with the 4 ohm speakers connected as shown, the input impedance of this network as seen by the output of the twin
amplifier drops from 5.0 ohm (for the dummy load alone) to ~ 4.4 ohm and so provides a sufficiently closely matched load to the nominal 4 ohm requirement.
With the TRR driven hard to its maximum level, the corresponding power delivered to the 4 ohm
twin speakers in this configuration is 5 - 8 Wrms. Of course much of the output power in this case is wasted as heat in the dummy resistors.
The TRR then starts to growl nicely without requiring ear-shattering sound levels, perhaps sounding similar to the Deluxe Reverb amp, and still providing significant volume for many situations:
Using a Pair of Power Tubes Instead of the full Quartet
The '65 TRR is designed with 4 power tubes operating in standard push-pull mode with two tubes in parallel on each side of the push-pull circuit. This output
circuit is designed to drive a specific output "load impedance" of 4 ohm at the maximum output so that the power tube max plate dissipation, about 20 - 25W the for stock tubes, is not exceeded.
The "plate to plate" load impedance Rpp is determined by load-line analysis of the tube plate characteristics taking into consideration plate dissipation during the maximum signal swing as detailed
in the RCA Receiving Tube Manual.
When this load impedance Rpp is determined, it is realized by selecting some standard output nominal speak load impedance ZL (on the secondary of the output transformer). Then assuming an ideal
transformer with turns ratio Np/Ns and with perfect power transfer from the primary circuit to the output load, the plate-to-plate load impedance is given by "reflection" of the output load impedance on the transformer secondary to the primary side (tube side) using:

Randy Couch's excellent Designing Vacuum Tube Amplifiers and Related Topics discusses many interesting and useful aspects of tube amplifier
design including non-idealities in the system.
In the design, a power transform of sufficient size to handle the current levels at peak signal is selected with the turns-ratio chosen to provide the required Rpp value for the
selected speaker load impedance Zl. For the '65 TRR amp, Np/Ns ~ 24 as measured directly by voltage ratio from plate-to-plate and transformer output.
Is it possible to lower the output power of the Twin Reverb amp and achieve greater tube distortion at the same drive levels by removing two power tubes?
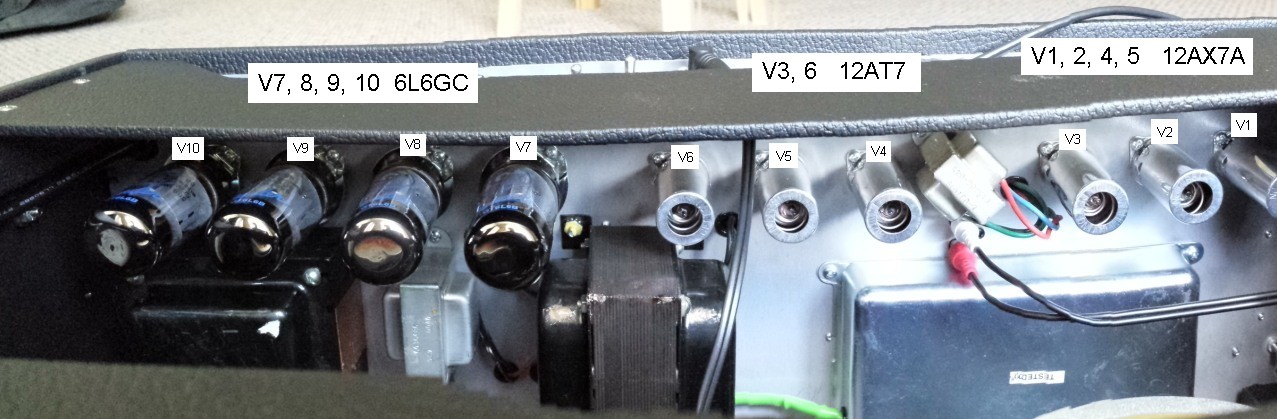
If a pair of the power tubes (either the "inboard" set V8 and V9 or the "outboard" set V7 and V10) is removed
this will produce an incorrectly "matched" driver output situation. Removing one tube on each side of the push-pull circuit requires the load impedance seen by the
tube circuit to be twice as high to achieve a similar design point. If no other change is made except for removing a set of tubes, the remaining power tubes will be driving the SAME load
impedance which is now too low by a factor of 2. The effective active load line for each tube is changed significantly and this will drive the plate dissipation beyond the safe limit for high signal levels (see detailed example below)!
However the load impedance seen by the remaining two output tubes CAN be easily raised by a factor of 2 by increasing the speaker
impedance by a factor of 2 since the load impedance seen by the output tubes is determined solely by speaker impedance times the output transformer turns ratio squared. Since the turns ratio
is fixed, all that need be done is to replace the stock 4 ohm paralleled speakers with say a single 8 ohm speaker with suitable power rating (as is often used in lower power push-pull amps with a single set of power tubes).
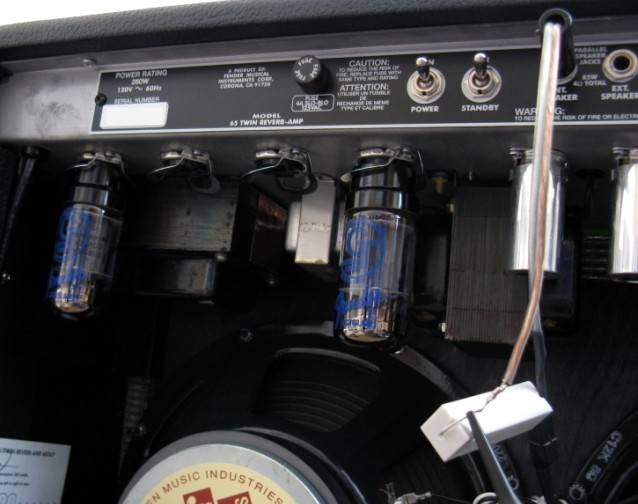
It is not difficult to configure a simple switching arrangement which achieves this, with the added benefit of saving a pair of the power tubes. The photo below shows the "inboard" tubes removed
and the power output was measured across a 10 ohm power resistor (approximating an 8 ohm speaker load). The maximum power into this load was measured at 45 Wrms, about
half that of the 85 Wrms value measured for the '65 TRR with all four power tubes. Therefore a switching configuration which uses ONE of the '65 TRR 8 ohm Jensen speakers will
have a suitable power rating for operation with two power tubes in this configuration :
Estimating Tube Plate Dissipation from Measured Output Power
Using well known expressions from tube push-pull design theory (e.g. RCA Receiving Tube Manual 1961, p. 23), it is possible to estimate the plate dissipation under maximum
signal swing from the maximum measured load output power without knowing the details of the tube plate characteristic. Assuming an ideal transformer, the power transferred to the output load is the same as the power delivered to the primary
load of the push-pull output stage. In the example below, measurements of the power output were made for the 2-tube case for the '65 TRR amp with resistive loads of 5 ohm and 10 ohm. As mentioned
above the 10 ohm (or more strictly 8 ohm) case is the proper output load design target when only 2 tubes are used. Consider the simple diagram below of the plate-voltage vs plate-current power tube
characteristic with different curves representing different control-grid voltages. For some nominal dashed load-line represented by curve A, lowering the Rpp value by a factor of 2 (by lowering the output load impedance
by a factor of 2) changes the load line to curve B. In both cases the idle tube voltage Eo (and bias current) are almost identical. The maximum grid-voltage swing (to Ec=0) represents the maximum
plate current value Imax. Obviously lowering the load-line resistance will increase Imax to I'max as shown and this will result in higher maximum plate dissipation:

The measurements below using a 10X probe correspond to the maximum output swing levels (before clipping) for 3 cases. The upper case uses all 4 power tubes and a 5 ohm resistive load (close to the 4 ohm nominal
speaker load) with output power (Vp)^2/(2*Zl) of 68 Wrms, somewhat lower than the specification of 85 Wrms for a 4 ohm load as expected.
Now consider the lower two measurements which use only 2 power tubes and with a 5 ohm and 10 ohm resistive
load respectively. The comparison below will show how lowering the load impedance by a factor of 2 increases plate dissipation considerably under maximum signal swing.
The RMS power output delivered to the load (for 2 tubes) for class AB1 operation (see RCA Receiving Tube Manual) is given by:

where Vo is the maximum voltage swing along the load line from the plate supply voltage Eo to the plate voltage at maximum current Imax. [Note that with 2 paralleled tubes on each side of the push-pull,
and with the correct value of half the output load resistance or half the Rpp value compared to 2 tubes, the Imax is twice that of a single tube since the same load line is in effect.
Therefore the Po value for 4 tubes (with say 4 ohm load) is twice that of a pair of
tubes (with the proper 8 ohm load). In other words each tube effectively contributes the same output power of ~ 22 Wrms to the load.]
The factor of 8 in the first expression occurs instead of a factor of 2 (peak-to-RMS conversion) because in each half-cycle of the push-pull operation, the active tube of the pair is driving
HALF the primary coil (and hence half the turns) from one winding side to the center-tap which is at AC ground, so the effective load a tube sees is Rpp/4 which also
of course occurs implicitly in the alternate expression for Po.
This Po expression must equal (for an ideal transformer) the measured RMS output power dissipated across the output load with measured values of:
Po(5ohm) = 36 Wrms and Po(10ohm) = 42 Wrms
For a given output load
(5 or 10 ohms in this case), Rpp is given by the expression above using a turns ratio of 24 with:
Rpp(5ohm) = 2880 ohm and Rpp(10ohm) = 5760 ohm.
Imax can then be calculated and is found to be:
Imax(5ohm) = 316 mA and Imax(10ohm) = 242 mA.
The average power supplied to the push-pull circuit comprising both tubes for this maximum signal swing condition is:

This expression strictly applies to a half-wave rectified plate current as in class B operation but is reasonably accurate for class AB1 in which at maximum signal,
each tube is cut-off for most of a 1/2 cycle as is the case for the TRR amplifier. At any rate it provides a good conservative margin for plate dissipation estimates.
With the measured plate supply voltage of Eo=455 VDC:
Psup(5ohm) = 91 Wrms and Psup(10ohm) = 70 Wrms.
The plate dissipation for maximum signal swing for EACH of the 2 tubes is then:

so Pdiss(5ohm) = 27.5 Wrms and Pdiss(10ohm) = 14 Wrms
per tube.
Note that although the power output Po to the load is somewhat LOWER for the 5 ohm load case compared to the 10 ohm load case,
the actual total power supplied to the push-pull circuit Psup is considerably higher for the 5 ohm load case. Therefore there will be greater plate dissipation!
The 14W rms plate dissipation for the 10 ohm load case for 2 tubes is well within the maximum plate dissipation range of 20-25W for the GT-6L6B (aka 5881). However with half
that load of 5 ohm, the maximum signal swing plate dissipation of 27.5 Wrms is higher than the maximum allowable plate dissipation. This is directly a
consequence of the modified load line due to a modified output load impedance.

Monitoring Plate Current, Plate Voltage and Control Grid Voltage
It is interesting to study the shape of the plate voltage and current in a typical guitar amplifier using a push-pull output stage. The Groove Tube bias tool is intended to monitor
the cathode (or plate) current of power-output tubes so that tube idle bias can be checked and adjusted when new tubes are used and to verify tubes in long service haven't
drifted. This is important so that the idle plate dissipation (idle plate current x plate supply voltage) doesn't exceed the tubes plate dissipation rating.
Amplifiers are designed so that the plate dissipation UNDER MAXIMUM SIGNAL SWING, also does not exceed the dissipation rating. It is possible to monitor the dynamic
cathode current using the Groove Tube Bias by simply monitoring the signal in parallel with a high-impedance scope (1Mohm is adequate). The setup is shown below:

To demonstrate typical
signal shapes, a '65 TRR amp was used with 2 tubes and with a resistive load of 10 ohm (close to the 8 ohm optimum). The idle plate current was measured using a DVM and the GT bias tool
to be 33 mA and the plate supply voltage at idle was 460 VDC as measured directly at pin 3 of an open socket. Although it is usually not necessary to measure and verify correct dynamic performance under signal, it is interesting
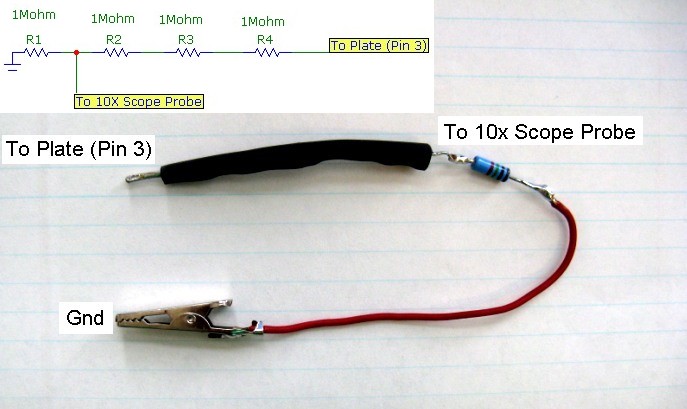
to observe the signal shapes. This was accomplished by using 4 1Mohm 1/2 W resistors in series to realize a voltage divider as shown below which lowers the voltage measurement to about 1/4. For an
overly conservative assumption of 200VDC maximum across each of the 1 Mohm resistors, each resistor would dissipate 40mW, well within the resistors power rating.
This is used in combination with a 300VDC rated 10X scope probe and a USB dual channel scope.
MEASURING HIGH VOLTAGES REQUIRES EXTREME CAUTION,
AND SHOULD ONLY BE ATTEMPTED IF YOU HAVE CONSIDERABLE EXPERIENCE AND THOROUGHLY UNDERSTAND ALL SAFETY PRECAUTIONS THAT MUST BE OBSERVED!.
The divider network and implementation is shown below. The tip of the divider was inserted into open tube socket pin 3 with the grounding clip attached. The combination of the voltage divider and a 10 Mohm scope probe has a conversion factor of 43:

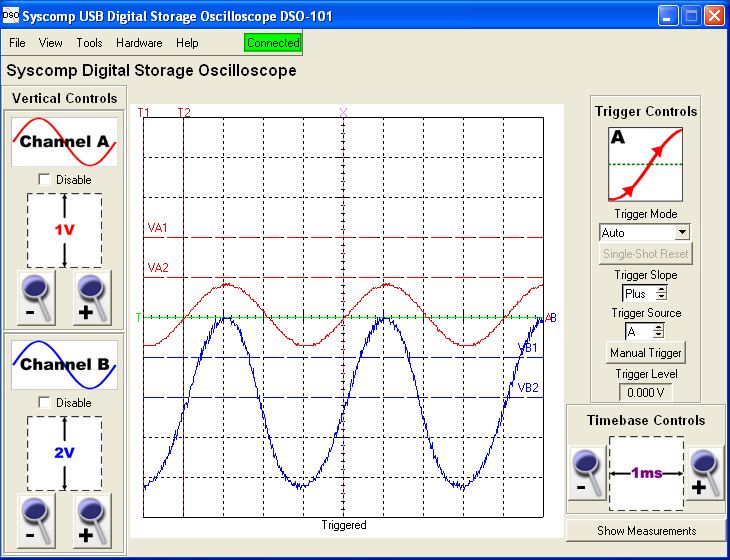
The first plot below shows the simultaneous output voltage signals for a 250 Hz input sine signal across the 10 ohm load (blue) and the plate current (red) for one of the push-pull tubes as
monitored using the GT bias tool which has a conversion factor of 1mA / 1mV.
The tube is seen to conduct current for somewhat more than 1/2 of a complete cycle corresponding to Class AB1 operation. The peak current SWING above the quiescent plate bias current
of 33 mA is about 160 mApeak. The power output to the 10 ohm load is about 15 Wrms, or about 1/3 the maximum power available with 2 tubes :

The traces below show the idle (zero input signal) voltages:

Finally the traces below show the plate voltage Vp (using the voltage divider discussed above) and plate current Ip:

Although the tube conducts substantially for only half a cycle, notice that the plate voltage continues to rise above the nominal plate voltage value of 460 VDC (the green T line in the picture)
to a peak value of 645 VDC during the tube's cutoff region.
The reason for this is found in the operation of the center-tap transformer: For the tube shown, during its "cutoff" section where little plate current flows, the OTHER tube is driving the OTHER side
of the transformer primary (which is half the primary turns). This generates output current in the load connected to the secondary of the transformer. This signal generated by the other active
tube will of course transform back to the FIRST tube circuit (call it a "back emf") since the transformer secondary turns overlap both halves of the primary turns.
This will therefore increase the plate voltage of the "cut-off" tube (think of it as a temporarily open circuit) with a voltage profile that looks very similar to that seen on the conducting active tube.
The part of the tube's plate voltage swing which actively creates the output signal is the decreasing part (roughly below 460 VDC) during which that tube is conducting. From the diagram, this
peak voltage swing (below 460 VDC) is seen to be 5*43 = 215 Vpeak (where 43 is the conversion factor for the voltage divider and 10X scope probe). The other tube has a similar swing also below
460 VDC but drives the other half of the transformer with current in the opposite direction in the winding thus creating an inverted output signal and creating a full sine output signal. Each plate during its conducting half-cycle drives
half the primary coil. Therefore for this example, the primary 215 V peak swing transforms to the secondary as 215/12 = 18 Vpeak in agreement with the peak output voltage measured above.
The blue traces below show the control-grid signals for the 2 power output tubes under near-maximum output power as monitored with a 10X probe at open socket pin 5.
The voltage divider used above for Vp measurements was not required due to the smaller grid voltage levels.
Input signal level to the amplifier (red) was ~ 800 mVpeak
and the amp controls were adjusted to achieve maximum output level to the resistive load. The idle (no signal) control-grid voltage was -46 VDC (for quiescent tube bias Iq = 33 mA). The control grid
voltage swings to 0V at the peak of the tubes conducting phase to ~ -85 VDC at maximum cutoff. The control-grid signals are inverted in phase as shown:

The sketch below shows qualitatively the various voltages, currents and Q point as measured for an audio cycle under typical bias conditions for the '65 TRR amplifier and with a maximum input voltage swing.
It pictorially shows how each power tube, during its strong conducting half-cycle, contributes piece-wise to the transformer output waveform:

Load-Line Design of Push-Pull For Maximum Power Output
Designing a tube push-pull amplifier for maximum power output has been discussed in great detail in the past. Most notably, a very thorough, in depth and insightful discussion is
provided in the seminal work Radio Designer's Handbook, Ed. F. Langford-Smith, 4th Edn. 1953/1957 (RDH). The intent here is to use the results from RDH to make basic
estimates of the maximum output power. For class AB1 push-pull amplifiers, it is shown in RDH that the maximum
power output, (assuming an ideal output transformer and resistive output load), can be well estimated by using the basic plate characteristic curve for a single tube for the maximum signal
case corresponding to the control-grid voltage Vc1 = 0 (instead of using the more complex composite characteristic for both tubes in the actual push-pull operation).
In fact, the same general expressions for maximum power output are shown to apply with fairly good accuracy for both triode and pentode power output tubes in push-pull. For both triodes and pentodes, the optimum plate-to-plate load resistance
(1/4 of the actual load-line slope for a single tube) which leads to maximum power output (for 2 tubes in push-pull) is that which makes the (single tube) load line have a slope which intersects
the single-tube plate characteristic, for the zero grid-voltage curve, at the negative of the same slope. For triodes, since the Ip vs Vp plate characteristic, at zero grid-voltage, has roughly a 3/2 power
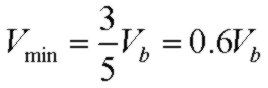
dependence on Vp, this intersection can be shown to occur at about 60 % of the quiescent (operating) plate voltage Vb (see derivation below). This first calculation is then used to check the plate dissipation under maximum signal swing to ensure
it is within the tube's plate dissipation limit and if not, the load resistance must be increased (RCA Receiving Tube Manual).
For pentodes, the considerations are very similar except that the screen grid influence causes a rather flat Iv vs Vp characteristic with a fairly sharp knee. This shape
leads to an equal-slope intersection point, for maximum output power, occurring at the knee for that plate characteristic curve. As a simple design example, the plate characteristic of the 6L6GC beam power tube from the RCA Receiving Tube
Manual is shown below. Different curves correspond to different screen-grid voltages with all curves for Vc1 =0, appropriate for maximum power output estimates in class AB1 service. Let's consider these curves and apply them
to predict the ideal maximum power output expected for the '65 TRR amplifier with 2 power output tubes and a "proper" output load of 8 ohm as described above.
The plate characteristics shown below are similar to those for the 6L6B (5881) stock tubes used in the TRR. The '65 TRR amplifier has a quiescent
plate voltage of ~ 455VDC and a quiescent screen-grid voltage just a few volts lower. Since the curves are only shown to 400VDC, I extrapolated to estimate the 450 V curve. Also by direct measurement
under maximum output power, it was verified that there is very little "sag" in the screen-grid voltage (~ 10VDC drop):

The load-line is drawn through the point Vp = Vb = 455VDC and through the knee of the plate characteristic for Vg2 ~ 450VDC for maximum the grid voltage Vg1 = 0. The slope of this curve 455V/0.415A = 1096 ohm is the load line resistance RL
for each tube driving half the primary winding. This resistance is 1/4 of the plate-to-plate resistance so Rpp ~ 4.4 kohm. With the output transformer of the TRR amp having a turns ratio of 24, the required output load,
through reflection is therefore 7.6 ohm which is close to the 8 ohm load as discussed earlier for two tubes. The maximum RMS power output at the transformer primary for 2 tubes is given by the product
of the RMS voltage and current swings or in terms of and plate load resistance as:

where Vmin = 60 V, Vmax = Vb = 455 V and Imax = 370 mA as shown in the graph. Therefore, for 2 tubes and the ideal 7.6 ohm output load (4.4 kohm Rpp load), the maximum power output expected into the
transformer primary is ~ 73 W. I tested my TRR amplifier under a resistive load of 8.3 ohm (which changes the calculated maximum power output to ~ 70W). Under maximum output signal level,
the voltage swing was measured to be (Vb - Vmin) ~ 353 V and the maximum plate current was directly measured to be 370 mA which leads to a measured primary power output of ~ 65 W which considering
the model is quite close to the predicted 70 W value. This is the power delivered to the transformer primary. The actual output power to the resistive load on the transformer secondary will of course
be less due to transformer losses. The measured maximum output signal at the 8.3 ohm load was V= 28 Vpeak which corresponds to an RMS output power of 47 W. Therefore the transformer loss is ~ 28%
or 72% is passed to the output load.
The plate dissipation of each tube can be predicted for any location on the load-line curve (not just the maximum power case) or determined using the measured plate current and voltage values at the transformer primary.
It is simply 1/2(total input power - power delivered to the primary load):

The expression for Pin is strictly speaking for class B half-wave plate current shape but it provides a worst-case conservative estimate of supplied power and plate dissipation.
[Note: It is important to recall that the power dissipation per tube may NOT necessarily be at its greatest value for the maximum power output point on the load line. In fact, the plate voltage swing which leads to the greatest
plate dissipation is (Vb - Vmin) = 2/πVb = 0.64Vb (or equivalently Vmin=0.36Vb). Therefore if Vmin at the intersection point with the plate characteristic is lower than 0.36Vb, the calculated Pdiss using this Vmin value will
underestimate the actual maximum plate dissipation which will occur for voltage swings less than the maximum possible value. However for simplicity in the calculations below, Pdiss will be computed for the maximum power output intersection point
shown above. See the section below for more detail and the correction factor.]
For the design example above, the total power input is 107 W and the maximum power output into the transformer primary load is 73 W so the power dissipation of each
tube at maximum output power is 17 W which is within the maximum plate dissipation spec for this tube (~ 25 - 30 W). [The actual maximum dissipation 0.36Vb point on the load line is 164V for
which the plate dissipation is slightly higher at 19.5 W but still within the dissipation specification.]
The above load line analysis has been done for a push-pull output with two tubes, one on each side of the push-pull circuit. If each tube is doubled in parallel (as in the '65 TRR amp with all 4 power tubes),
the maximum power analysis doesn't need to be repeated as it is identical to that above provided that the output load is halved. The single-tube load line above is used just as if each tube was independently driving the same load as in the 2 tube case.
This is equivalent to saying that two tubes in parallel have effectively half the plate resistance of a single tube so the load resistance seen by the combined parallel tubes must be halved to maintain the same load-line position.
Therefore each tube individually delivers the same Imax as the single tube case and the peak voltage swing is identical. Since both paralleled-tubes are driving the same current into the same primary
side of the transformer, for the same voltage swing as for the 2 tube case, the primary load impedance seen by the combination of the 2 paralleled tubes must be half that of the single tubes version.
Therefore the optimum output load impedance for maximum power output for 4 tubes must be reduced from ~ 8 ohm to ~ 4 ohm (assuming the same transformer is used) corresponding to the 2 parallel 8 ohm speakers in the TRR amp.
The maximum power delivered into the transformer primary for 4 tubes is therefore exactly TWICE that of the 2 tube case. The power supply must now deliver twice the power to the circuit (since total plate current is twice as high)
for the same Vb plate voltage (assuming Vb doesn't "sag" under the greater current draw).
The total power output is doubled with each tube delivering exactly the same power individually as in the 2 tube case. The output transformer must obviously be capable of handling the higher current
and power. Since there are 4 tubes, the power dissipation per tube is identical to the 2 tube case.
As a useful perspective, the chart below shows predicted power results for the '65 TRR amp, using the 6L6GC plate characteristics above, for exact 4 and 8 ohm output resistive loads and an ideal output transformer.
The numbers only include plate and load power dissipations and are for the maximum signal swing (to Vg1=0 for class AB1 operation).
The final column shows the output load power assuming a reasonable 70% power transmission through the output transformer:
            Pin(total)     Pout(tot)   Pdiss(per tube)     Pout(70%)
            ----------     ----------  ---------------     ---------
2 Tubes
 4 ohm        120 W          46 W         37 W               32 W
 8 ohm        101 W          71 W         15 W               50 W

4 Tubes
 4 ohm        202 W         142 W         15 W               99 W
 8 ohm        104 W          75 W          7 W               53 W
Note the excessive power dissipation for the 2 tube case with an output load impedance or 4 ohm or 1/2 the recommended 8 ohm value.
Assuming a 70% power transmission, the predicted result of 99 W for the normal 4 tubes and 4 ohm nominal load is consistent with the spec of 85 Wrms minimum
for this amplifier. It is usually safe (from a tube dissipation perspective) to use a somewhat higher impedance load value than that corresponding
to the maximum power output load. As shown in the chart, the total power input, plate dissipation and output power are all lower for a higher impedance load. However it will be potentially harmful
to use a very high output load (or an open circuit) since in this case, the reflected load will not appear resistive to the driving tubes.
This will cause the transformer primary load to appear strongly inductive which will cause excessive voltage swing on the primary which may
damage the power tubes.
Maximum Plate Dissipation Along Load Line:
The calculations above assumed the maximum plate dissipation occurs at the maximum power output value corresponding to maximum plate voltage and current swing. However this is
not exact. It is easy to show that in fact for any load line, the maximum plate dissipation occurs for a voltage swing value (Vb - Vmin) = 2/πVb = 0.64Vb or equivalently for Vmin = 0.36Vb (assuming
each tube is cut off approximately for half a cycle).
Therefore, for class AB1 operation, if the load line intersection point with the plate characteristic for Vg1=0 is at a point Vmin > 0.36Vb, then the plate power dissipation calculated based on the maximum power
output point will correctly give the maximum possible plate dissipation for any intermediate voltage swing. However, for intersections which allow greater maximum voltage swings, Vmin < 0.36Vb, the plate dissipation calculated above based on the
maximum power output point will UNDERESTIMATE the maximum plate dissipation. In this case maximum dissipation will occur at a lower voltage swing corresponding to Vmin = 0.36 Vb.
For designs which have maximum plate voltage swings of roughly Vb/2 or larger (as in the example above for the TRR with proper plate loads) the exact expression for the true maximum plate
dissipation per tube in terms of the plate supply voltage Vb and the plate load resistance RL provides a suitable conservative value:

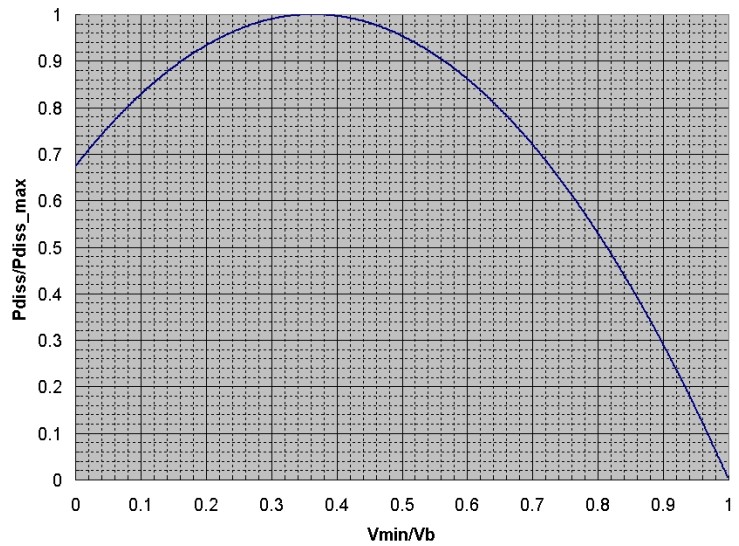
The charts below show a typical load line with the
quantities defined (as above), and the plate dissipation (relative to the maximum possible value) for any voltage limit on the load line Vmin/Vb.
As mentioned, for Vmin values greater than 0.36Vb, as will be the case for triodes with typical load lines, no correction is needed.
For Vmin values lower than 0.36Vb, which is frequently the case for pentode characteristics designed properly for maximum power, the curve can be used to determine the correction factor.
This is applied to dissipation calculated based on the maximum power output to obtain the true maximum plate dissipation (or the exact expression above can be used).

Push-Pull Calculator for Class AB1:
The push-pull calculator below can be used to compute approximately the total supplied power Psupply, total output power Pout and plate dissipation Pdiss per tube for an even number of tubes.
Vmin and Imax refer to ANY load line coordinates for a SINGLE tube in the equivalent load line. Vmin, Imax specify some signal swing point on a load line corresponding to some control-grid voltage
in the set of plate Ip vs Vp characteristics which obviously depends on the details of the tube (pentode, triode) characteristics.
Imax and Vmin are identical for all tubes in the balanced push-pull circuit.
For maximum output power calculations, Vmin and Imax correspond to the maximum power output point (load line intersection with plate characteristic for Vg1=0).
RL refers to 1/4Rpp. RL is identical to the slope of the load line for a single tube for the 2 tube case. For 4 or more tubes, RL still refers to 1/4Rpp but
the slope of the effective load line on the single tube characteristics, since pairs of tubes are in parallel, is Req = N*RL/2 where N is the total number of tubes. Thus with 4 tubes, lowering RL by a factor of 2
will produce the identical load line for each tube with the identical power per tube and dissipation per tube as discussed above. The calculator uses Psupply = 0.636ImaxVb for each pair of tubes which assumes
each tube is cut off for approximately half a cycle. This provides a conservative worst case estimate of plate dissipation.
This calculator can be used in 3 ways:
- In all cases, enter Tubes, Vb, Vmin and ZL
- Enter Imax and click Use Imax. RL and Np/Ns will be calculated/updated and the power fields updated
- Enter RL and click Use RL. Imax and Np/Ns will be calculated/updated and the power fields updated.
- Enter Np/Ns and click Use Np/Ns & ZL. RL and Imax will be calculated/updated and the power fields updated.
The calculator has no restrictions on any parameters and uses the linear slope of the load line to calculate Imax if "Use RL" or "Use Np/Ns &RL" are chosen. Since Vmin and Vb are always specified
as input parameters, this will uniquely determine Imax.
The calculator results will clearly only be useful if Imax is an achievable current level for the tubes with the specified Vmin. This can only be determined by inspection of the actual tube's plate characteristics.
The lower section shows, for the supplied value of Vb and load resistance RL, the maximum dissipation point Vmin = 0.36Vb and the corresponding maximum plate dissipation per tube Pdiss_max calculated
using the expression above:
Parameters:
- Tubes total number of tubes in push-pull circuit
- Vb plate supply soltage
- Vmin minimum voltage (maximum swing) along load line
- Imax maximum current per tube along load line corresponding to Vmin
- RL primary load resistance for half push-pull circuit = 1/4(Np/Ns)^2ZL
- Np/Ns primary to secondary turns ratio for output transformer
- ZL output load impedance
- Psupply total power supplied to entire push-pull circuit
- Pout total output power into transformer primary
- Pdiss=(Psupply - Pout)/Tubes power dissipation per tube for signal swing to Vmin, Imax.
- Vmin (lower) minimum voltage along load line for maximum plate dissipation
- Pdiss_max maximum possible plate dissipation per tube
Derivation of 60% Rule for Triode Push-Pull Maximum Power:
The diagram below shows a typical triode plate characteristic (blue) at zero control grid voltage (Vg1=0) and a load line (magenta) corresponding approximately to the maximum
power output condition for a class AB1 push pull amplifier. The power output expression Po in terms of the plate voltage swing (Vb-Vmin) and current swing (Imax) is
identical to that above for pentodes and applies for any load-line (plate load resistance) intersection, not just the maximum Po case:

To determine the load line slope which provides the maximum achievable Po value, we assume the Vg1=0 plate characteristic follows a 3/2 power Child's law shape for thermionic
emission from a cathode. Then using some basic calculus, it is easy to find the intersection point corresponding to maximum output power and to prove that it really
is a maximum power point:

where A is some constant which depends on the tube details.
The power ouput Po corresponding to any intersection point (any load resistance and Vb value) is:

The rate of change of Po is zero at the maximum Po value. Differentiating with respect to the intersection point Vmin and setting the result to zero:
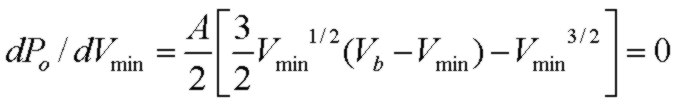
Solving for the value of Vmin which provides maximun Po:
To verify that this is a maximum (and not minimum or saddle point) we examine the sign of the second derivative at the critical value above:
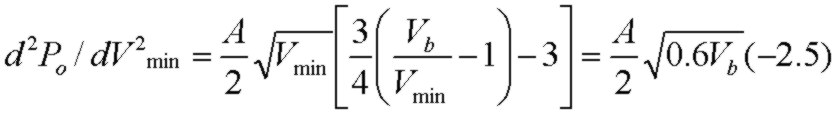
and since this is always a negative value, we indeed have found a MAXIMUM Po value.
The slope of the load line at this maximum power point Vmin=0.6Vb is obviously -Imax/0.4Vb and it is easy to show that the slope of the plate characteristic curve at
the maximim power intersection point (dashed green line) is just the negative of this Imax/0.4Vb = 1/RL where RL=1/4Rpp is the load resistance corresponding to this load line.
For 2 triodes and a load line chosen for this maximum output power intersection at 0.60Vb, the maximum power output (both tubes) is:

and the corresponding power dissipation per tube for the intersection point is:

Thus at this maximum power point, the power output for both tubes and power dissipation per tube are nearly identical.
A more accurate analysis (see Radio Designer's Handbook) of triodes in push-pull uses the actual "composite characteristic" of both tubes (difference current of both tubes).
The composite characteristic has a nearly linear slope (compared to the single triode 3/2 power law shape) with a slope value which will be
very nearly the same as the local slope (dashed green line) shown above for maximum power output using a single triode characteristic. This is true because at the maximum power output point, one of the tubes will
be at cutoff so the slope will be that of a single conducting tube. It is easy to show, using an analysis identical to that above, that for such a perfectly linear "composite
characteristic", the maximum power intersection point corresponds to equal slopes for the composite characteristic and load line. It is therefore intuitively obvious that for
a pentode under typical design conditions, the maximum power will again be given by the point of equal slope intersection. In this case however, since the pentode characteristic
has a sharp knee at low voltage, the slope of the Vg1=0 plate characteristic curve corresponding to maximum power in AB1 service will change very rapidly at the knee. Thus the equal
slope location (at Vmin and Imax) will occur approximately at the knee position.
References:
- RCA Receiving Tube Manual, Technical Series RC-21, 1961, p.23
- Radio Designer's Handbook, Ed. F. Langford-Smith, 4th Corrected Edn. 1957, Ch 13.6 Push-pull pentodes and beam power amplifiers, Class A, AB1", p. 583.
- Designing Vacuum Tube Amplifiers and Related Topics, 2nd Edn, Randy Couch, 2013
- The Tube Amp Book, Aspen Pittman, 4.1th Edn., 1995
- Bias Kit Manual, Groove Tubes LLC, 1999
- Inside The Fender '65 Twin Reverb Reissue Amp